
Metrics for tokens, cost and running time
Compare agent activity across your workspace and see the effort behind each task.
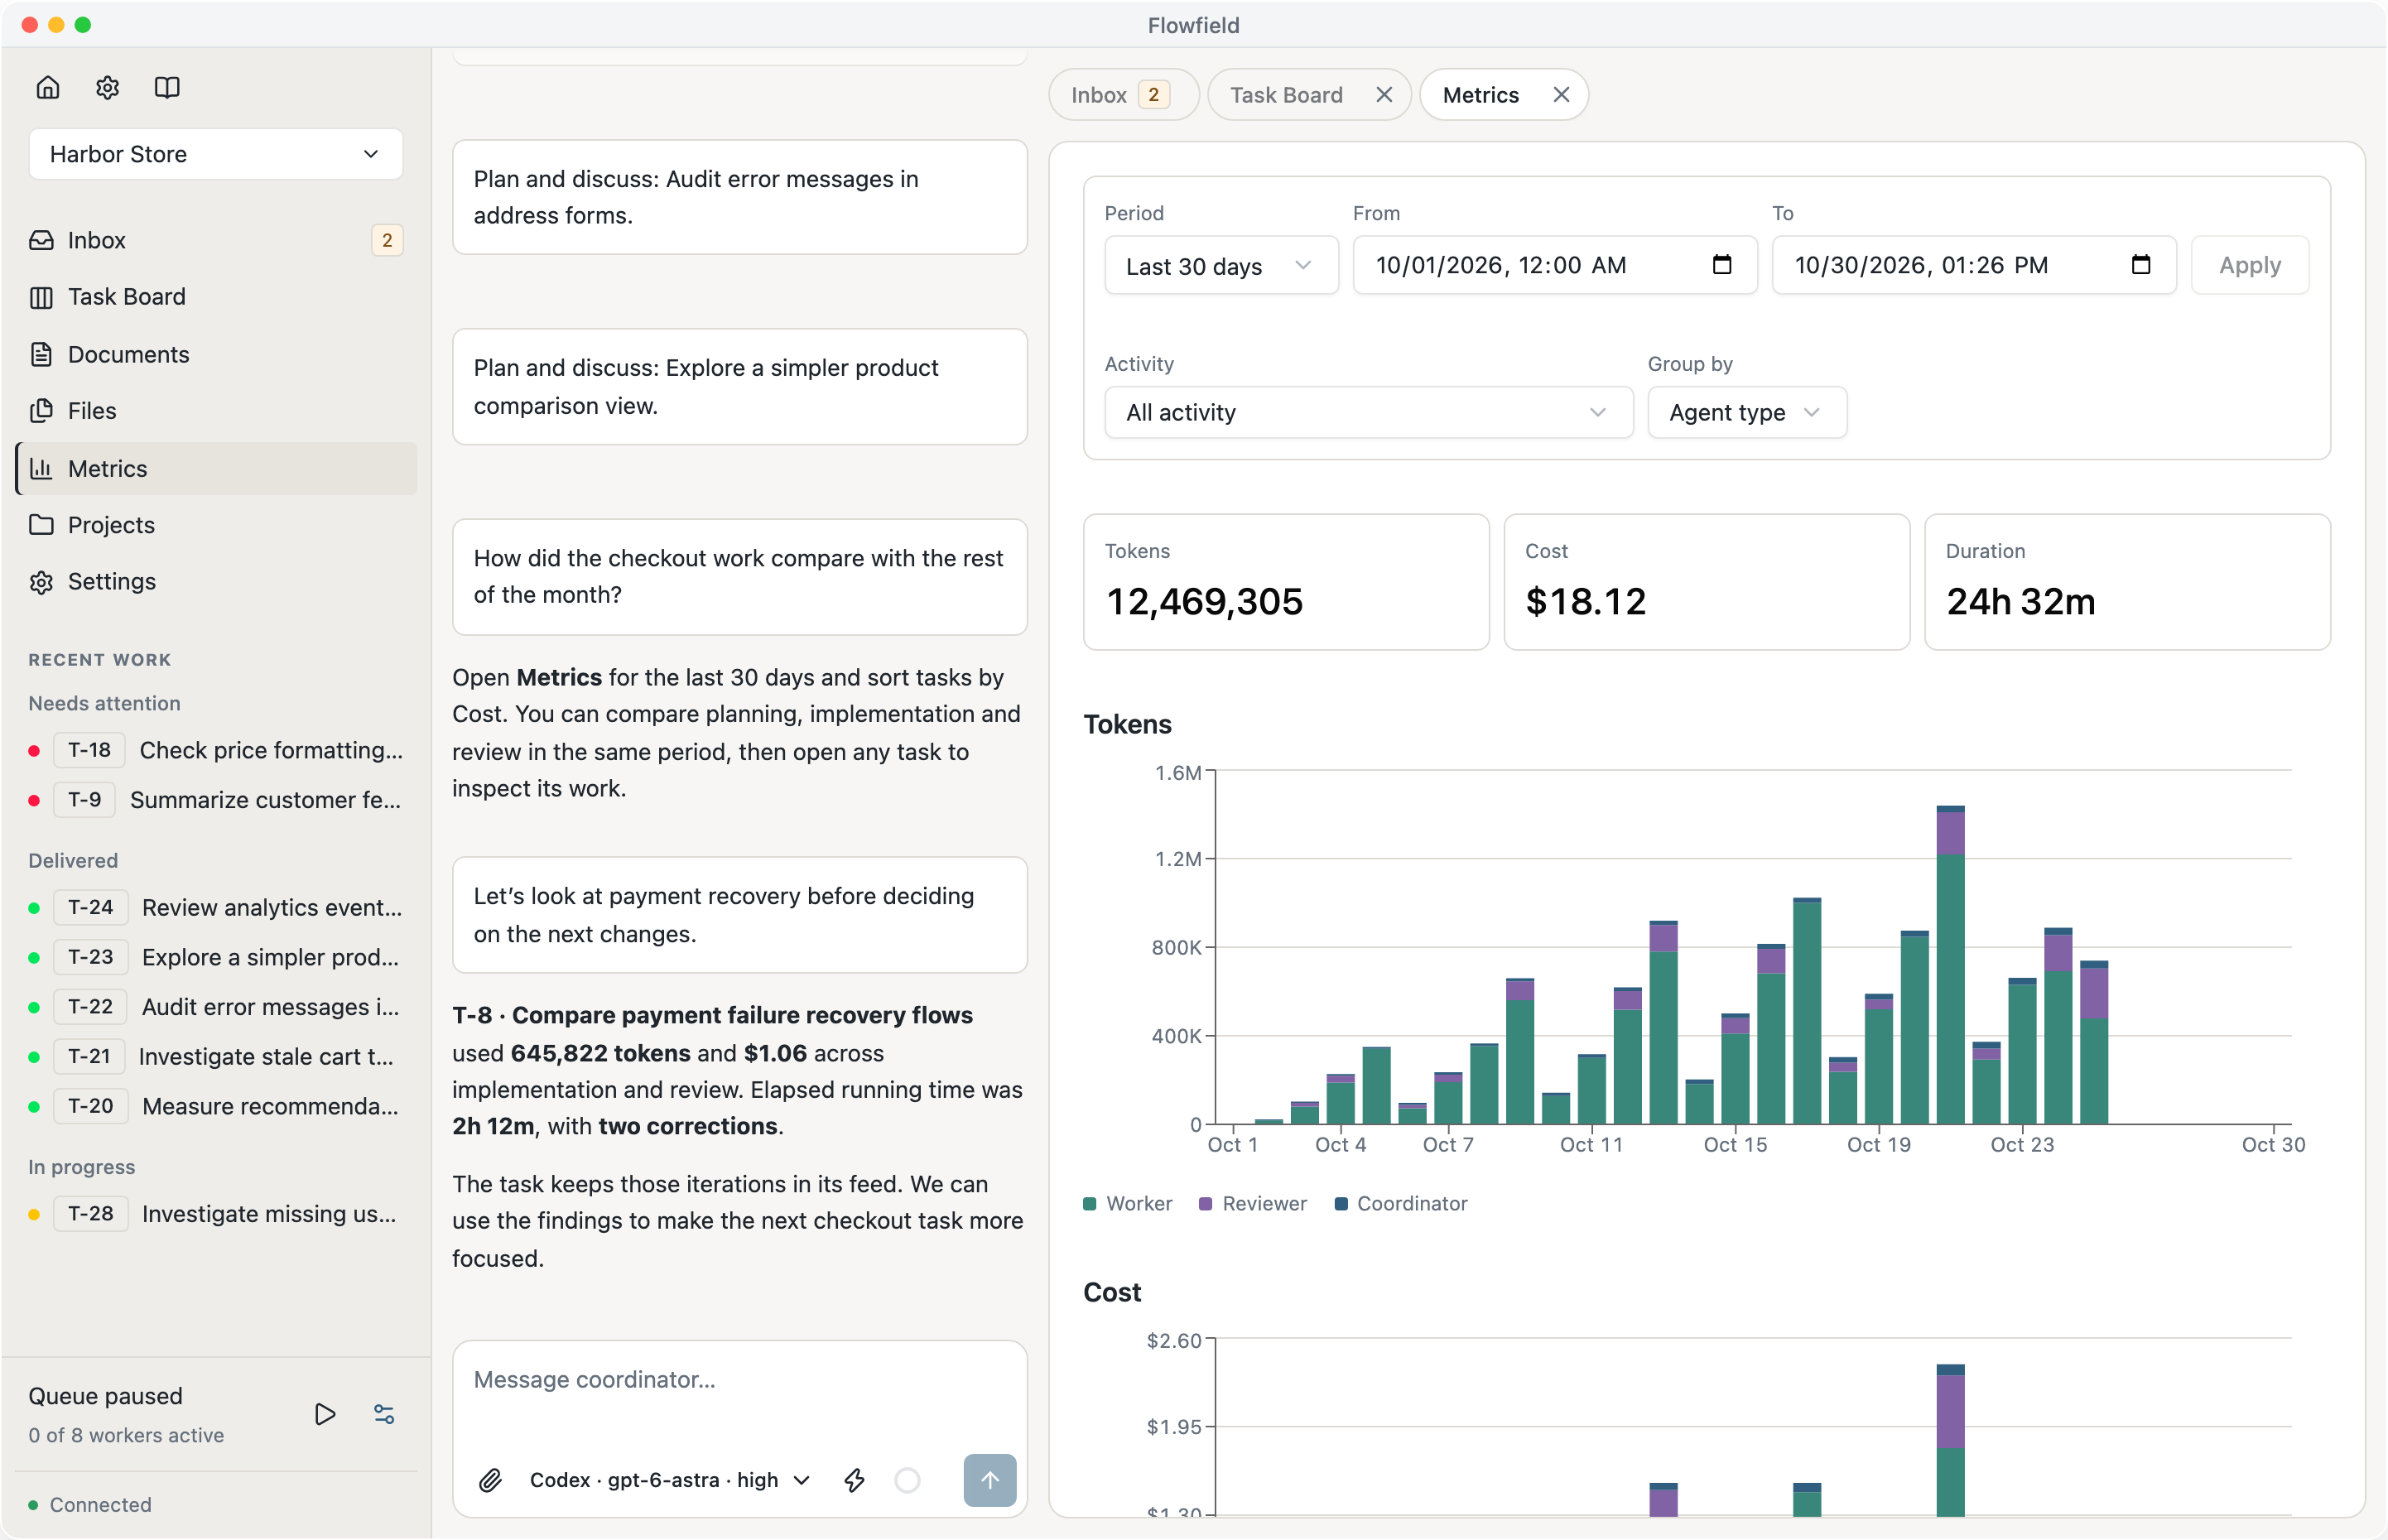
Flowfield now includes Metrics for your workspace and tasks. Track tokens, cost and running time without collecting numbers from individual agent sessions.
Cost estimates the API price of reported usage, using each model’s input, output and available cache details.
When several agents work in parallel, a finished result tells only part of the story. Metrics helps you see which tasks took the most time or cost, and how that effort was split between planning, implementation and review.
Compare activity across your workspace
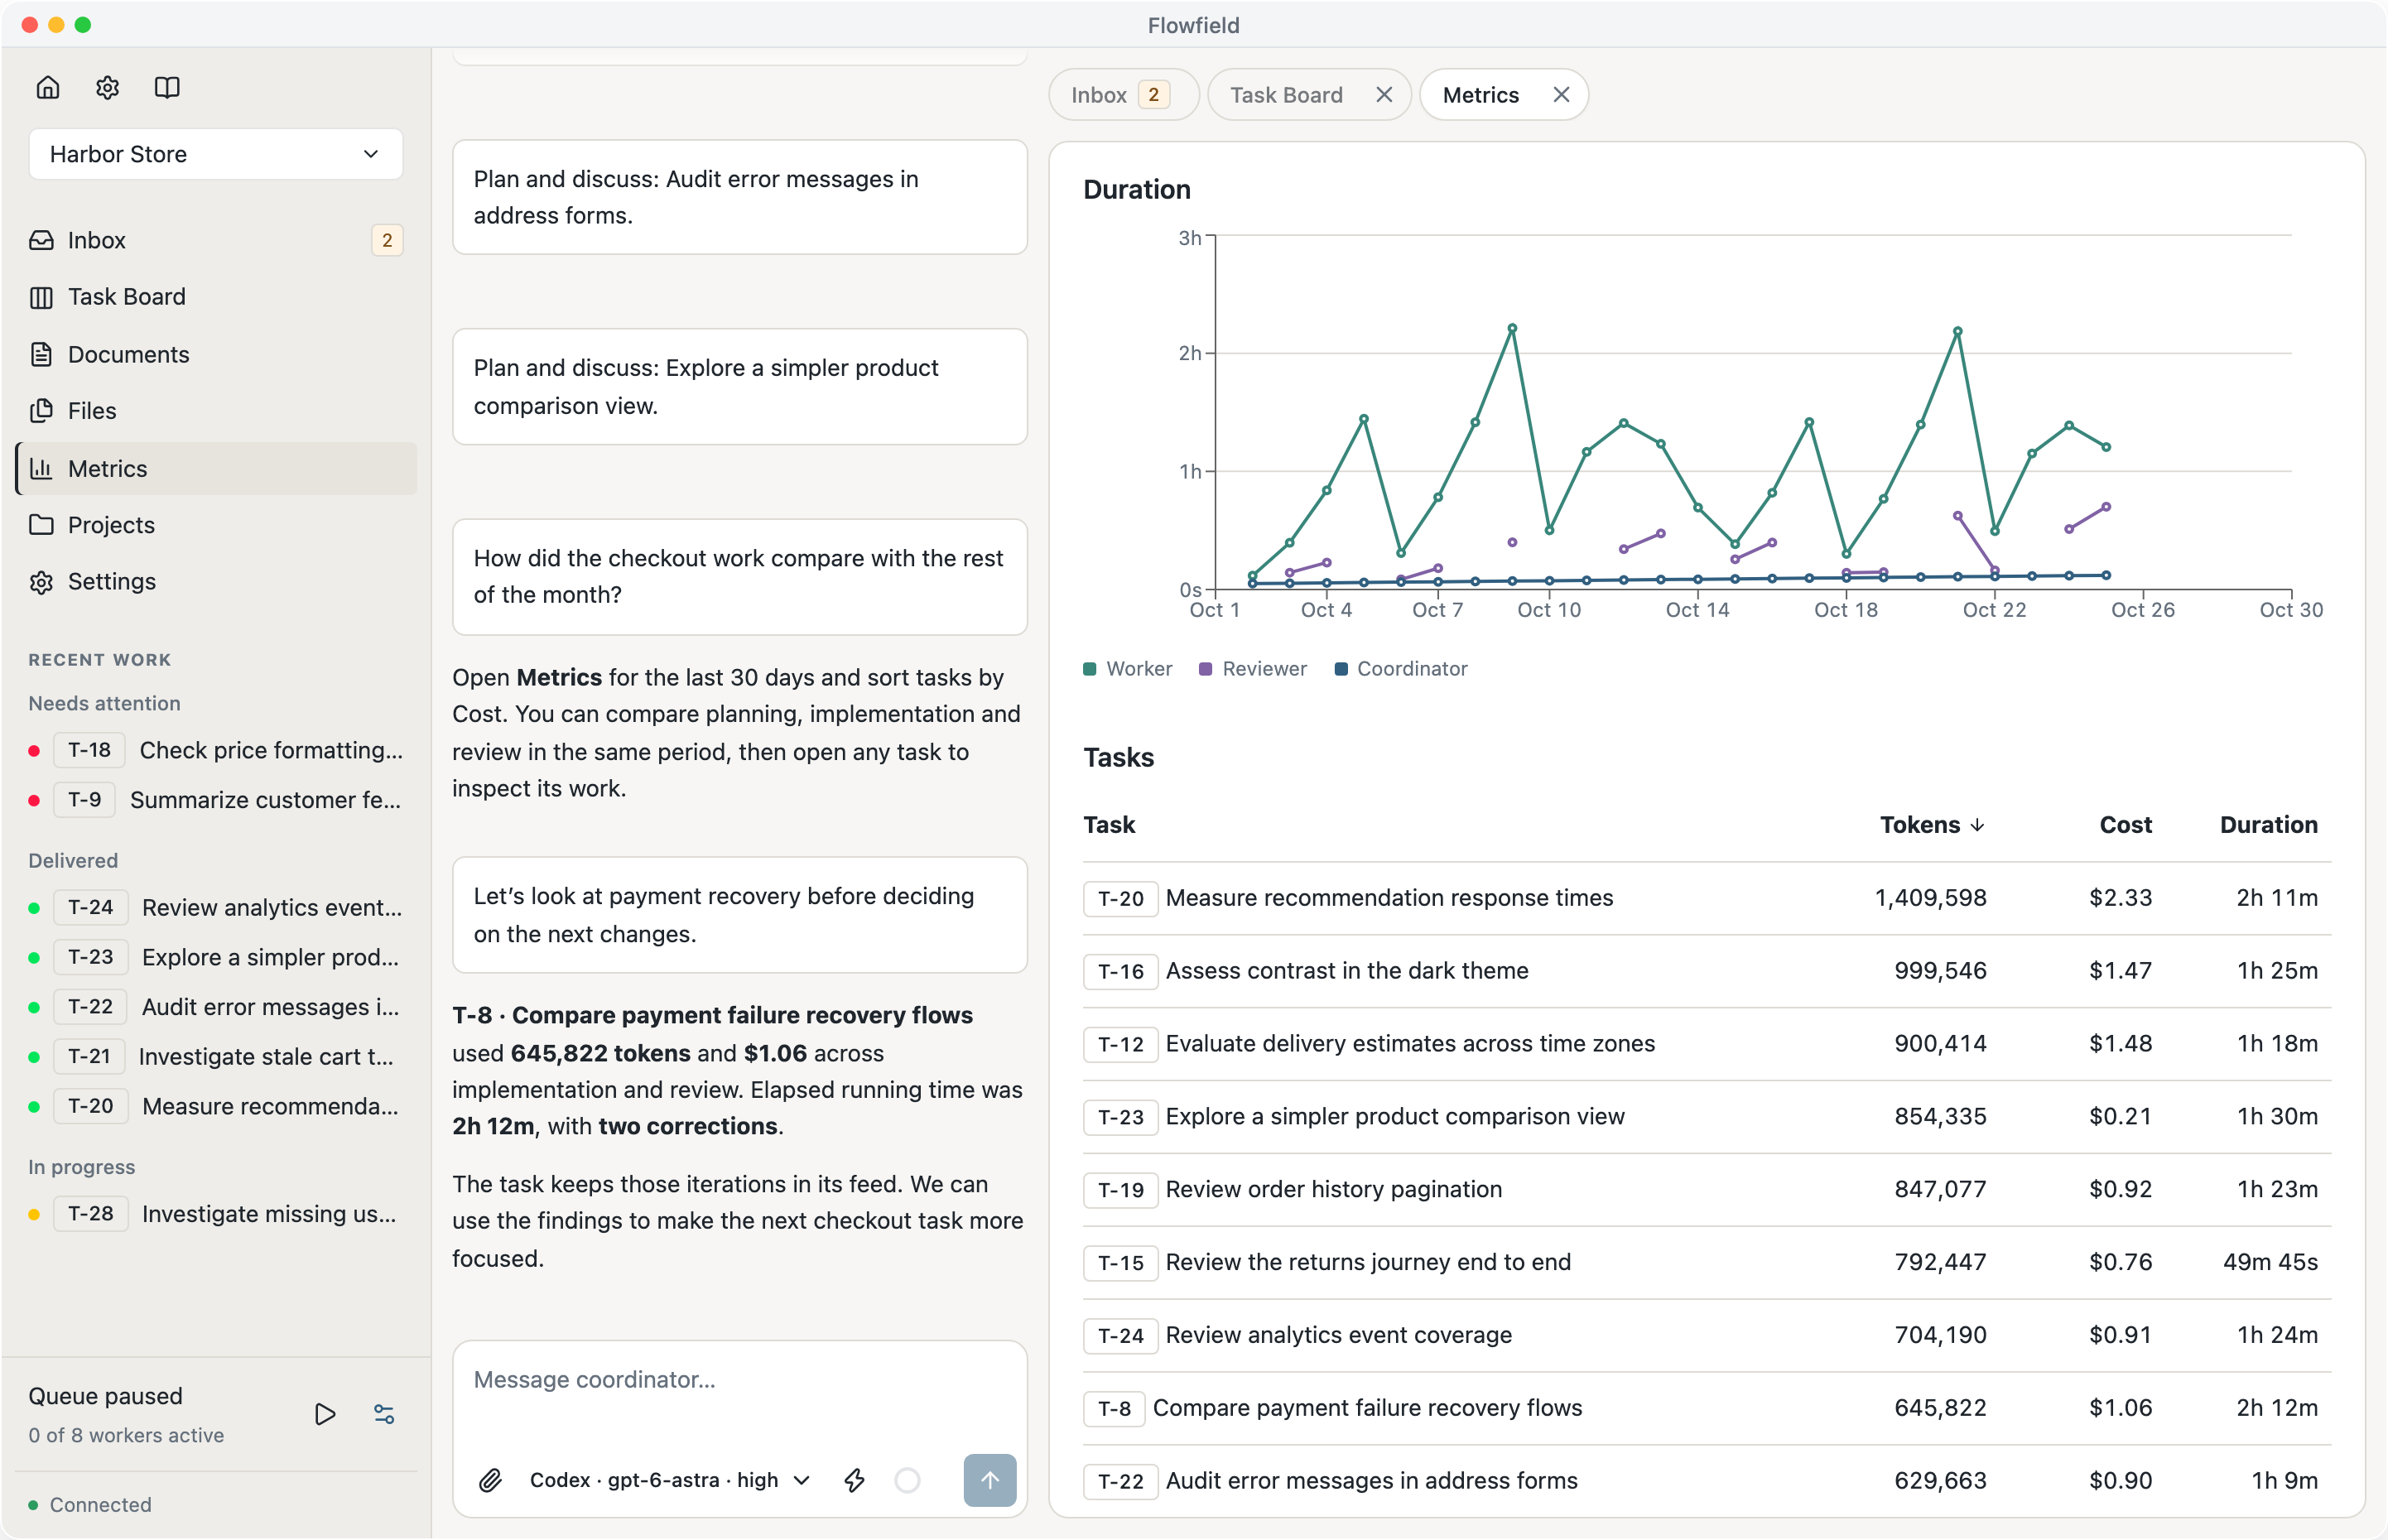
Review a busy week, compare agent types, harnesses or models, or focus on one task. Charts show how activity changes over time, and the task list helps you find the work you want to investigate.
You can move from the workspace overview to a particular period or task without losing the connection between the numbers and the work.
See the effort behind a task
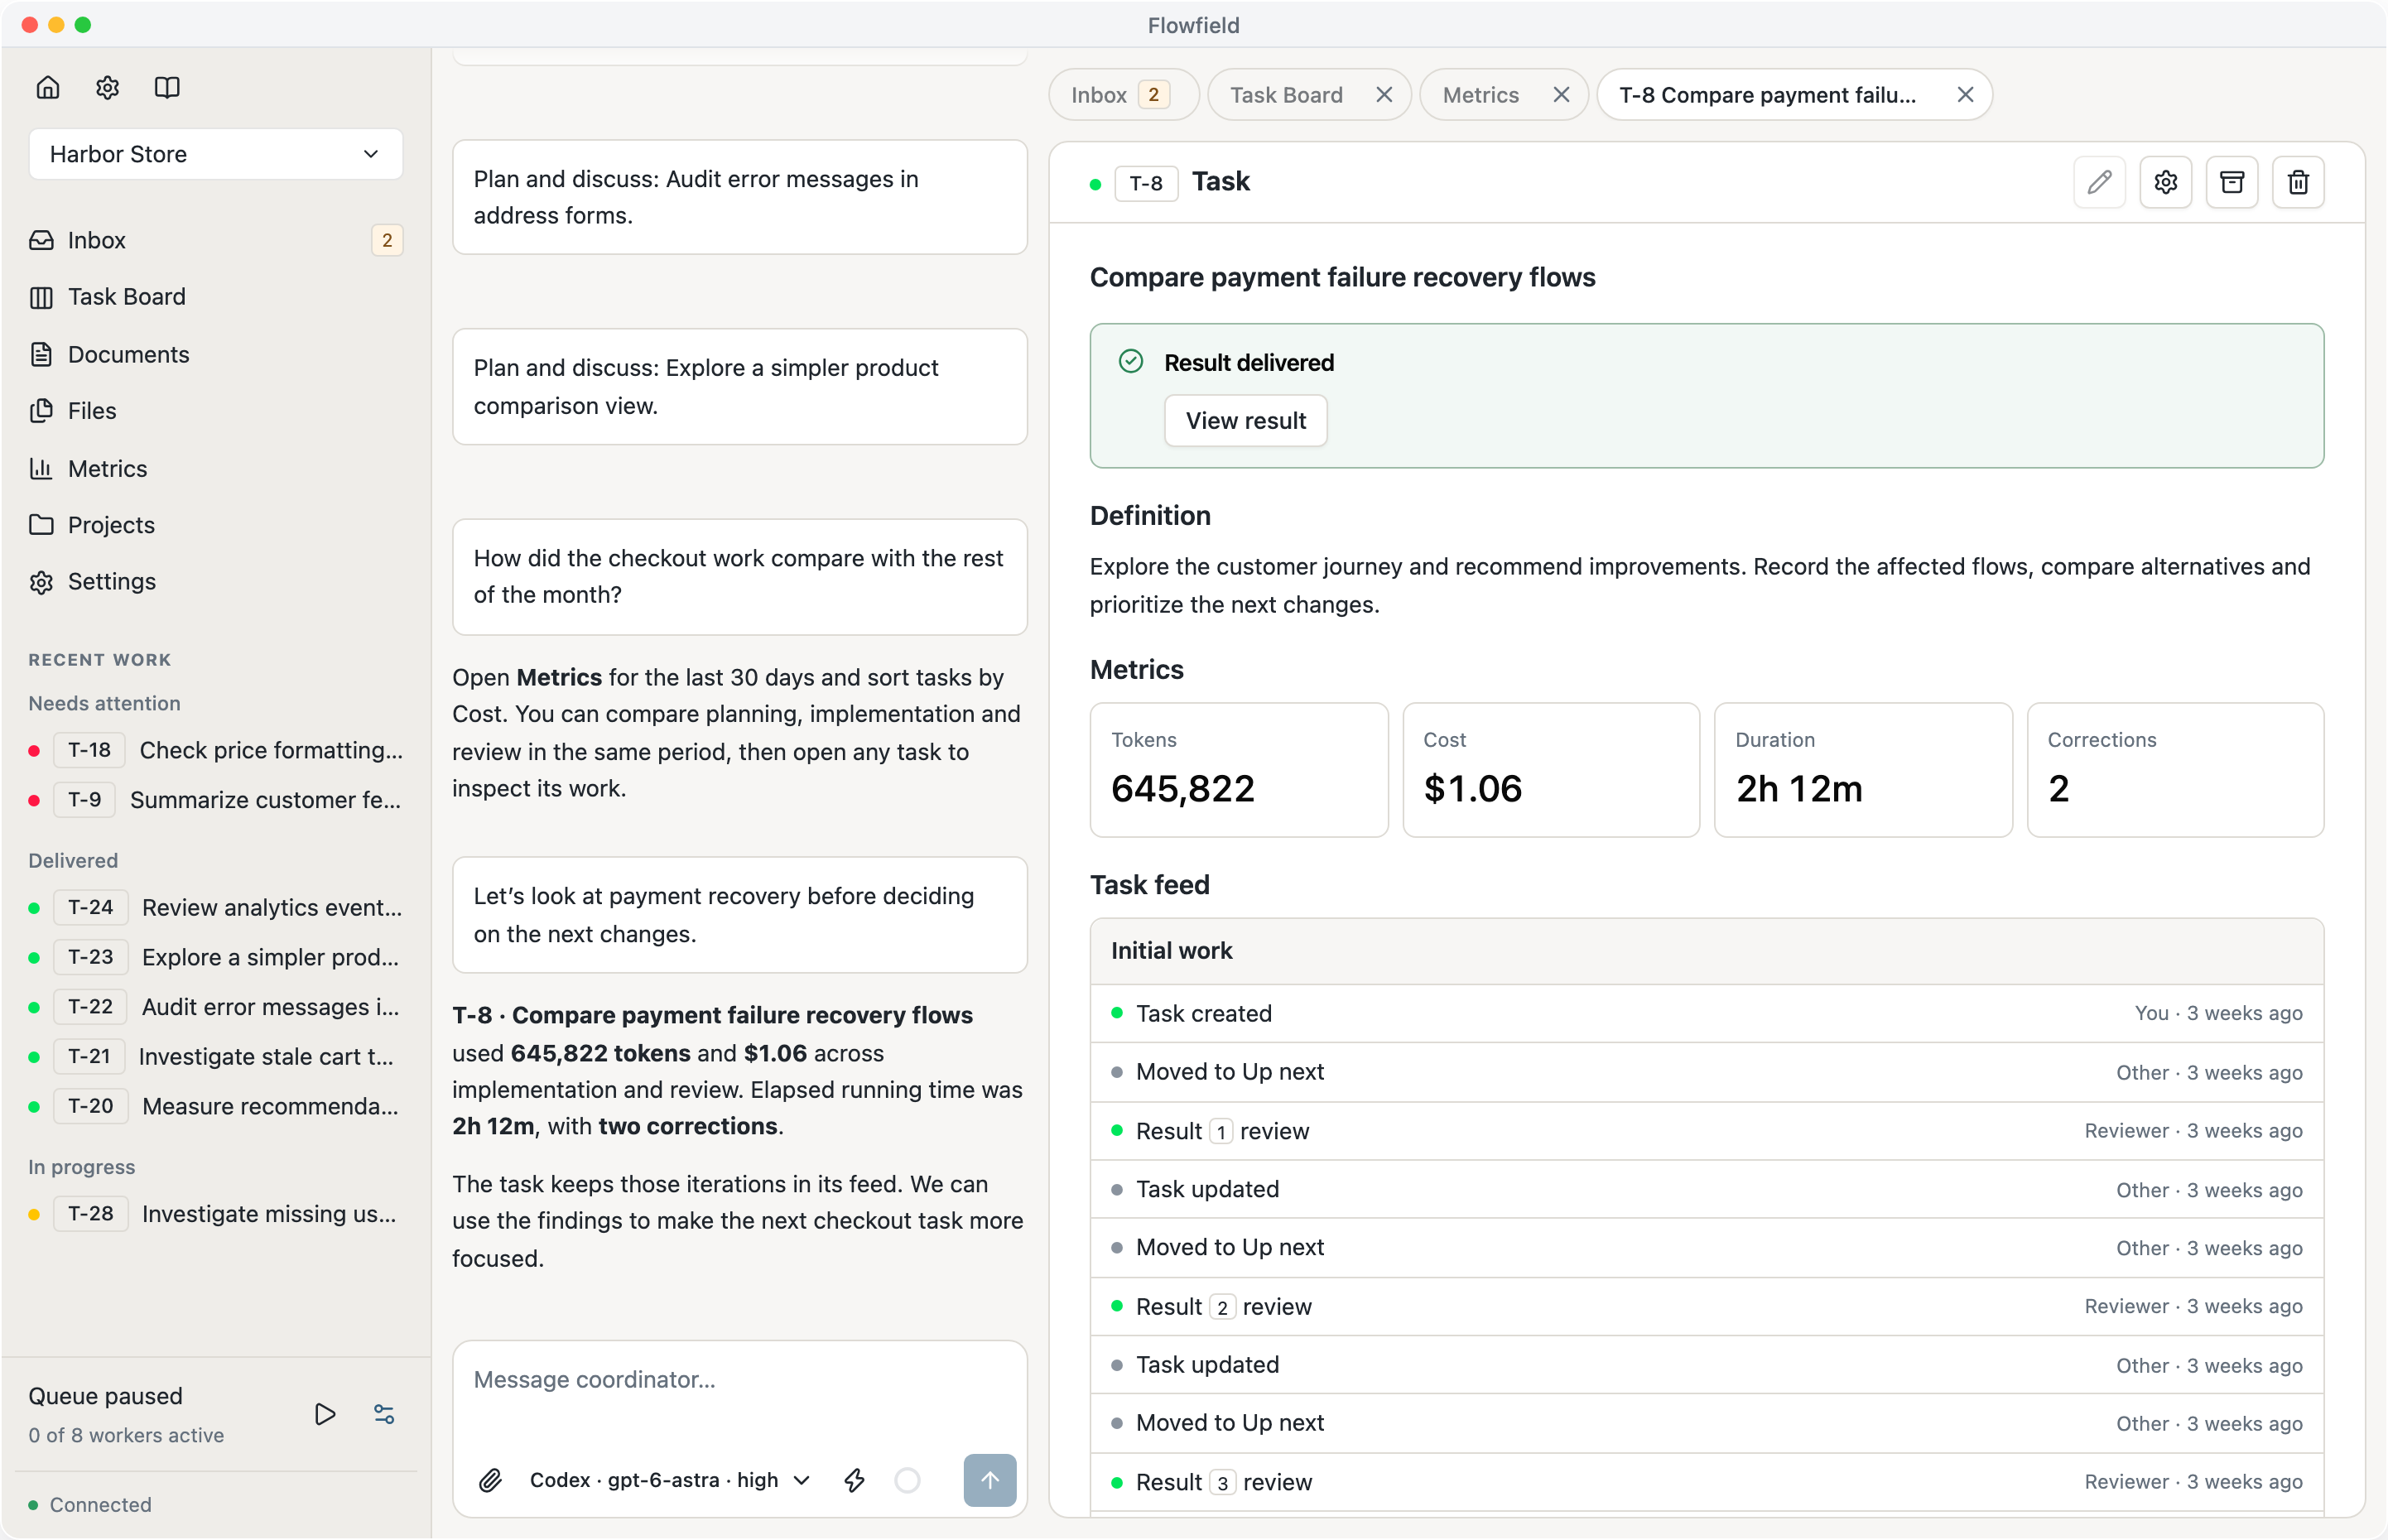
Each task shows its tokens, cost, duration and corrections alongside its definition and activity. Follow the numbers back to the work and feedback that produced the result.
A task that needed several corrections may deserve a closer look before you plan similar work. Keeping its effort and history together makes that review easier.
Read the Metrics guide (opens in a new tab) to get started.